
Stop guessing what happens in your store.
Your POS report tells you how many people bought; it doesn't tell you how many left without buying. EscherSense turns your existing security cameras into retail intelligence: it anonymously reads the customer journey from the moment they walk in to the moment they leave the checkout, shows where sales are lost and makes those losses actionable.
1,284VISITORS TODAY38.4%CONVERSION2:10CHECKOUT WAIT
In retail, the most expensive event is the one never recorded
Every item that passes the checkout is on record. But the customer who stops at the shelf and walks away empty-handed, the shopper who sees the queue and abandons the basket, the aisle nobody visits: none of it is written into any system. This is exactly where the industry's biggest losses pile up.
Three steps, using the cameras you already have
Connects to your existing cameras
We take the RTSP stream directly from your in-store security cameras. No new cameras, no new cabling, no downtime; installation doesn't affect store hours.
AI reads the floor in real time
The video feed becomes measurable signals such as visitor count, path, density, demographics and product interaction. Decision latency is measured in seconds.
Produces actions, not just reports
Heatmaps, conversion rates and performance charts are tied to concrete actions such as "open a checkout", "move the aisle" or "shift the roster".
Your data stays within your walls
No facial recognition, no identities stored. By default, processing happens on-premises in the store; it can also run in the cloud if your IT policy requires.
Every square metre of your store, as measurable data
Capabilities build up in four layers: first you measure core traffic, then you understand behaviour, next you automate operations and finally you predict what's ahead. Each layer is built on the data of the one before it.
Layer 1 · Core analytics
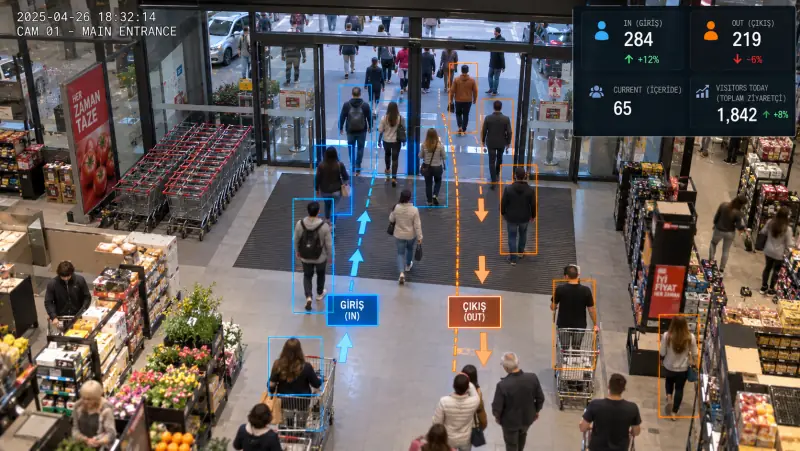
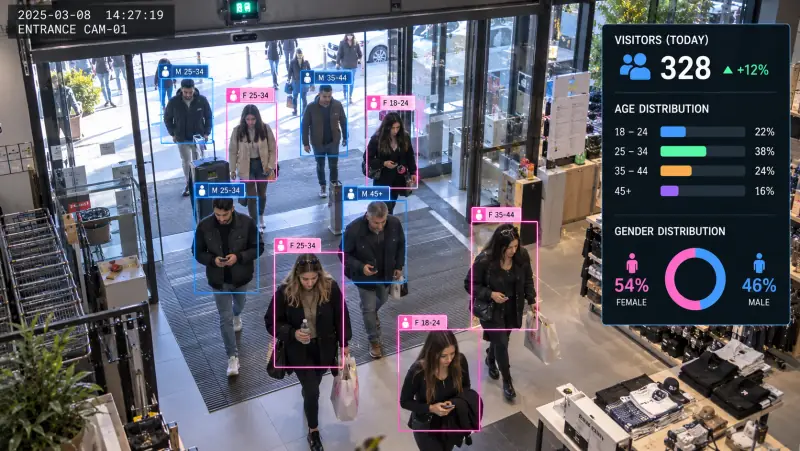
Accuracy 96.2%People counting and demographics
Visitor numbers are measured with 96.2% accuracy; age and gender profiles are derived anonymously, in line with KVKK/GDPR.
Heatmaps and density
Your store's hottest and deadest zones become visible on the floor plan; product placement is driven by density data, not gut feeling.
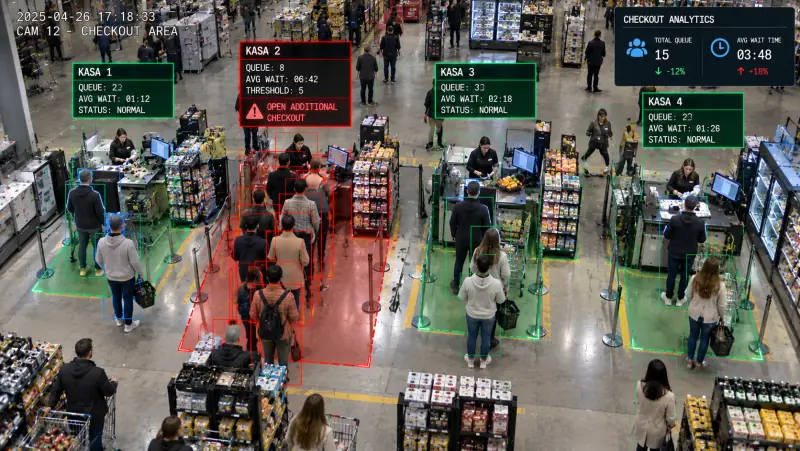
Queue and checkout management
Checkout wait time is measured in real time; when a threshold is crossed, an open-a-till alert goes out and basket abandonment is stopped at the source.
Storefront traffic and conversion
Passers-by in front of the window are compared with the share who walk in, putting a number on your storefront's real pulling power.
Layer 2 · Behavioural intelligence
Accuracy 95.4%Path analysis
One step beyond the heatmap: movement between aisles is visualised, and cross-selling opportunities are read straight from the paths shoppers take.
Product interaction (micro-gestures)
Looking is not the same as touching. Picking up, examining and putting back are each measured separately, revealing the true level of interest.
Window effectiveness score
Measures how many of the people passing your window actually look at it, proving the return on your visual merchandising investment.
Segment analysis
Cues such as prams, shopping bags and group size separate family and solo shopper segments, so campaigns are built for the right audience.
Layer 3 · Operational automation
Accuracy 92.8%Staff activity analysis
Staff are recognised by their uniform; time spent with customers versus idle time is reported objectively. The process is assessed, not the individual.
Shelf tidiness score
The model learns the ideal shelf layout, scans the current shelf and raises an alert when deviation exceeds the threshold.
Real-time alert chain
Critical events reach mobile devices instantly; an unanswered alert is escalated to the next level after a defined period.
True conversion rate
Combining visitor counts with POS data shows exactly how many of the people who enter the store actually buy.
Layer 4 · Forecasting and strategy
Accuracy 95.1%Footfall forecasting
Future footfall is predicted from historical data; rosters and stock levels are planned against the forecast, and forecast consistency is measured weekly.
A/B testing module
Physical changes such as moving an aisle are compared before and after on the same metrics, so the debate ends with data.
Benchmarking
This Friday versus last Friday, this store versus another: performance is compared on the same scale, and the whole chain is managed from a single dashboard.
Campaign ROI measurement
A campaign's impact on traffic, engagement and conversion is tracked separately, so the marketing budget is allocated by real return.
Get to know EscherSense in short videos
The intro film covers the whole platform; each module video shows what it measures in the store. Figures in the videos are illustrative demo values.
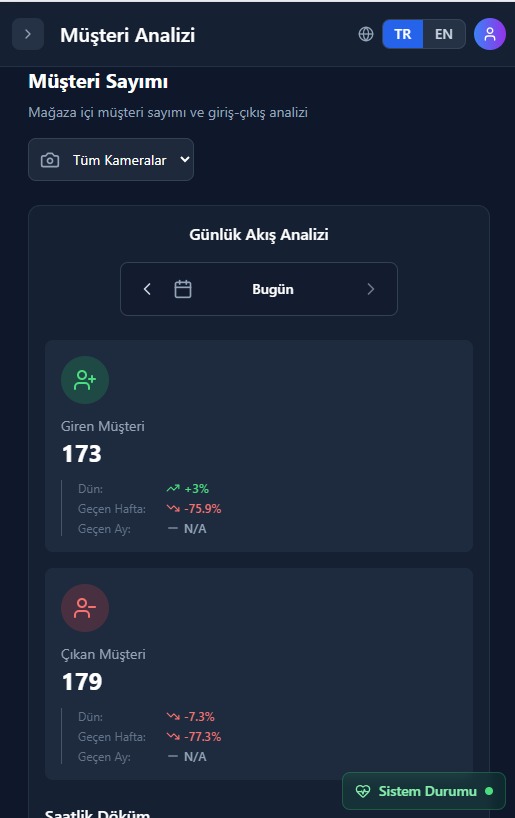
Mobile Analytics
Monitor your stores from anywhere. Applications are distributed through enterprise channels with custom branding and configuration options available for large deployments.
- Real-time Notifications — Get instant alerts for queue buildups, staff productivity changes, and sales anomalies
- Live Store Monitoring — Monitor live store analytics, heat maps, and customer flow from anywhere
- Mobile Reports — Access detailed analytics reports and KPI dashboards on mobile
- Custom Alerts — Set custom alerts for specific retail metrics and thresholds
Flexible Pricing Plans
All plans include professional installation, training, and ongoing support. Pricing varies based on deployment size and specific requirements.
Starter
Perfect for small retail stores getting started with analytics
Professional
Advanced analytics for growing retail businesses
Enterprise
Complete retail analytics solution for large chains
Know the answer before the store closes
The dashboard doesn't wait for the end-of-day report. Traffic curve, conversion rate, zone density and event feed update live on one screen, so you can act before the shift ends.
Figures on the dashboard and live plan are illustrative demo values.
Watch a store's day in 18 seconds
How many people came in, where they stopped and where they never went, who left without reaching the checkout, and the conversion dip at peak hour: the picture EscherSense builds for a store, in one short film.
Figures in the film are illustrative demo values.
Every retail format has its own leak points
Supermarket and grocery
- Checkout queues and abandoned baskets
- Managing density in fresh produce
- Whether promoted products get noticed on the shelf
Fashion and apparel
- Fitting room to sale conversion rate
- Which windows and aisles draw attention
- Staff–customer interaction time
Electronics
- Long waits while customers compare products
- The moment technical help is needed
- The real impact of a new product launch
Beauty and personal care
- Density and engagement at tester stations
- Spotting the promotions that drive traffic
- Raising average basket value
Not a separate island, but part of your existing stack
EscherSense talks to the CRM, ERP, POS and marketing automation at the heart of your store. Its flexible API layer brings the power of the data into your existing operations without a painful rollout.
RESTful API
Well-documented endpoints give full flexibility for custom integrations.
Webhook support
Real-time event notifications keep systems instantly in sync.
Flexible data formats
Full compatibility through industry-standard JSON and CSV output.
Enterprise security
Encryption in transit and at rest, role-based access and audit logs.
People counting technologies: what does each one measure?
Four technologies are commonly used for counting in retail. The accuracy gaps are smaller than you might think; the real difference is how much data you can get from the same investment. The figures below are field averages.
| Technology | Accuracy | Scope | Hardware | Field note |
|---|---|---|---|---|
| Infrared beam counter | 80–90% | Counting only | Device per door | Misses group entries, limited direction detection |
| Thermal counter | 90–95% | Counting | Device per door | Anonymous, but produces no behavioural data |
| 3D stereo camera | 95–98% | Counting, partial direction | Dedicated camera install | High accuracy, narrow scope and high hardware cost |
| mmWave radar | 90–96% | Counting, occupancy | Sensor install | No video; no event verification or evidence recording |
| EscherSense video analytics | 96.2% | 16 metrics | Existing cameras | Counting, paths, queues, shelf interaction and conversion from one feed |
Counting on its own is a single metric; it doesn't drive decisions. Knowing how many people came in doesn't explain how many stopped at which shelf and why they left without buying. That's why EscherSense treats counting as a starting point and builds behaviour, operations and forecasting layers from the same footage.
Today's dashboard, tomorrow's decision engine
Digital twin and simulation
Simulate major changes, such as reducing the number of checkouts, on a virtual copy of your store before rolling them out physically; take the risk out before you decide.
Plain-language executive briefing
A large language model turns the day's complex data into an executive summary: what happened today, what needs attention and which action comes first.
Brand partnership portal
Offer the brands on your shelves a paid portal with anonymised analytics for their own product areas, turning data from a cost line into a revenue line.
From the blog
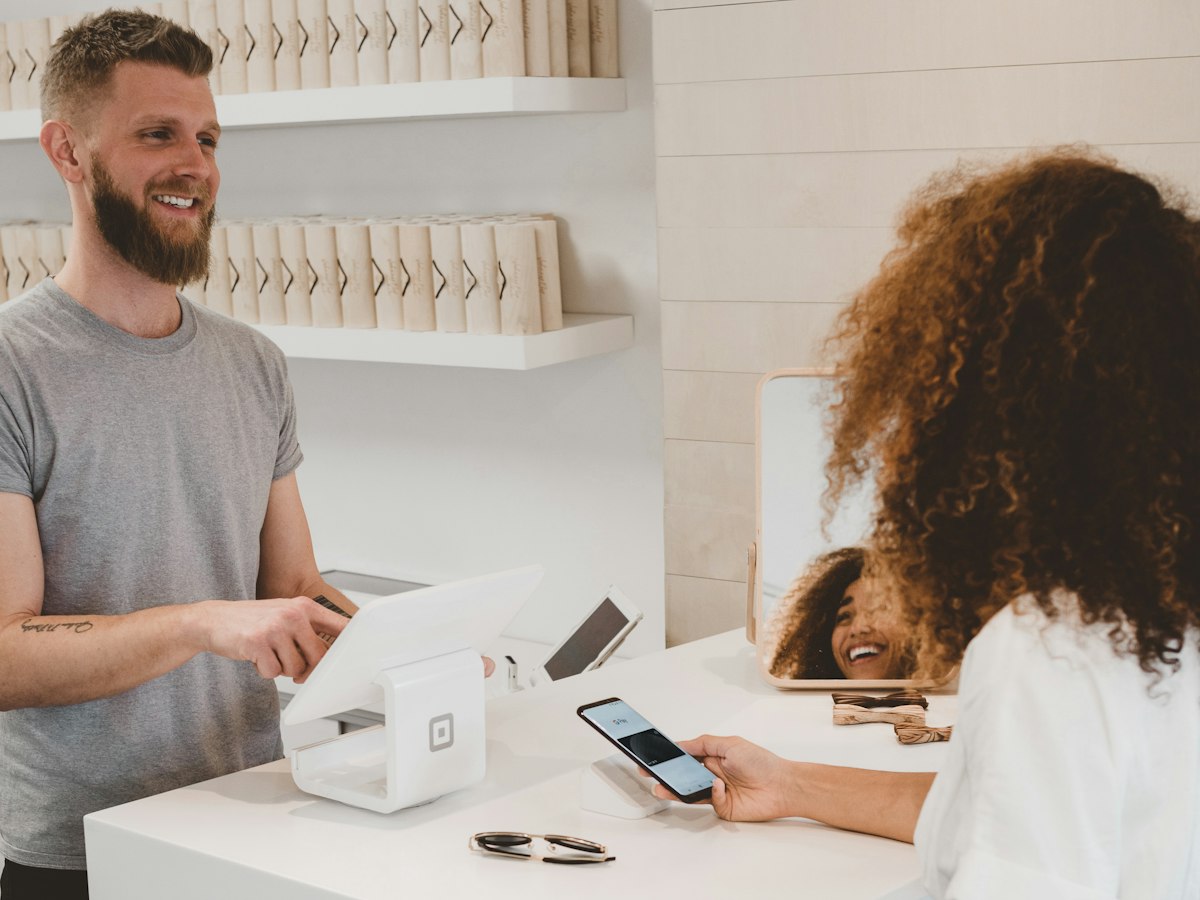
How to Increase Sales with Retail Analytics
Discover how data-driven insights can transform your retail operations and boost sales by 40%. Learn practical strategies from successful retailers.

AI in Retail: The Future is Now
Explore how artificial intelligence is revolutionizing customer experience and operational efficiency in modern retail stores.
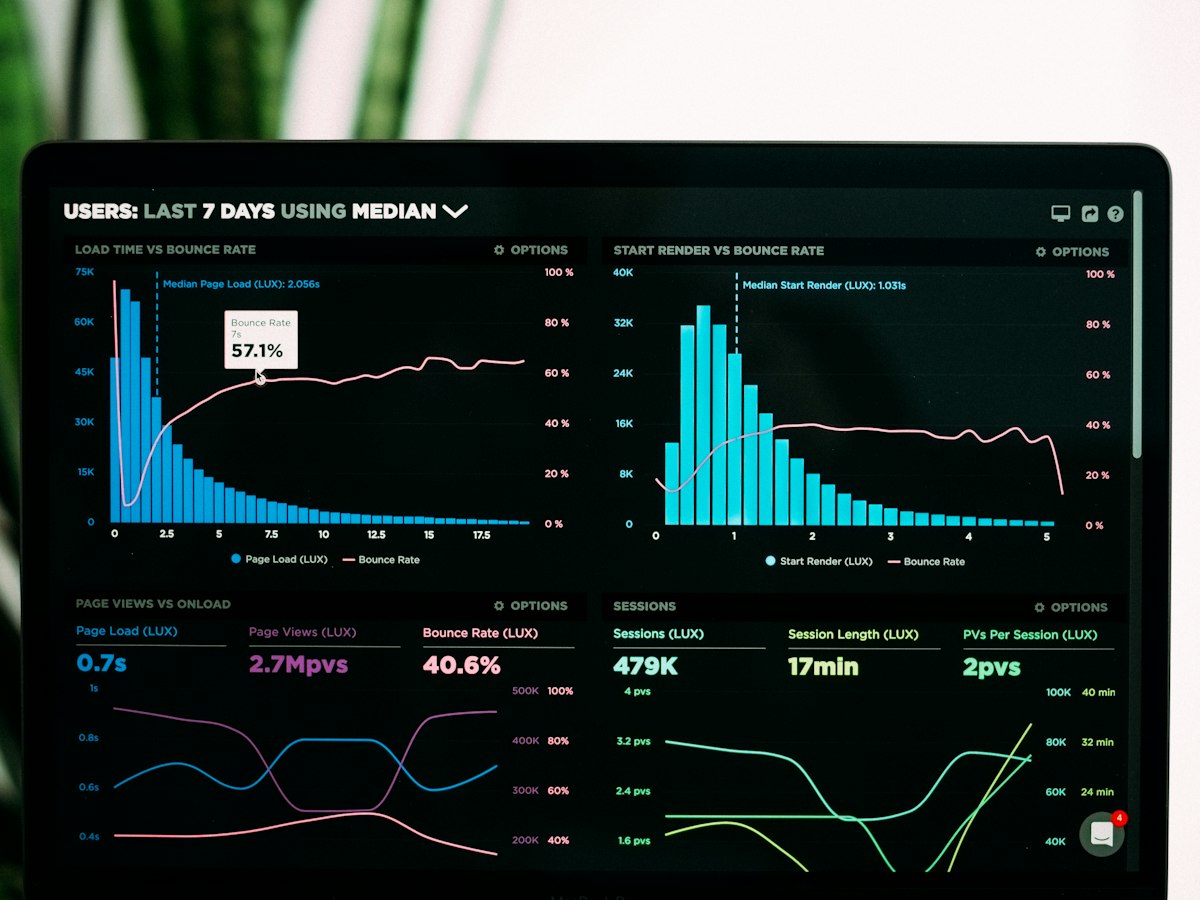
Understanding Customer Behavior Patterns
Deep dive into customer journey mapping and behavior analysis to create personalized shopping experiences that drive loyalty.
Frequently asked questions
Are my existing cameras good enough?
In most cases, yes. Any ONVIF-compatible IP camera that provides an RTSP stream will work. Before installation we assess your camera angles free of charge and report which position can support which analytics.
Is it KVKK/GDPR compliant?
Yes. No facial recognition is used and no identity data is stored; measurements are anonymous and aggregated. Processing runs on-premises in the store by default and can run in the cloud if preferred; retention periods are defined.
How long does setup take?
A single-store installation is typically completed within one week, followed by a 30-day pilot (measurement) period. The store stays open and cabling is unchanged; by the end of the first week you see your real traffic and conversion rate.
Does it work with my POS and ERP?
Yes. It connects to your POS, ERP, CRM and BI tools via REST API and webhooks, and its JSON and CSV output fits into your existing reporting without disruption.
What is the accuracy rate?
Field-measured figures vary by module: 96.2% for core counting and traffic analytics, 95.4% for behavioural analysis, 92.8% for operational modules and 95.1% for forecasting models.
How does it work across a multi-store chain?
All stores roll up into a single dashboard. The benchmarking module compares stores on the same metrics, and campaign impact is measured both chain-wide and store by store.
What drives the price of a people counting system?
Cost comes down to three things: the number of cameras, the analytics modules you choose, and whether processing runs in-store or in the cloud. Because your existing cameras are used, the camera line is zero on most projects, so the upfront investment is markedly lower than with solutions that require buying infrared counters or 3D sensors. A firm price for a single-store pilot is provided within two business days of a free site survey.
Which is more accurate: camera-based counting or infrared sensors?
Infrared beam counters count two people walking in side by side as one and can't tell direction; typical field accuracy is in the 80–90% range. Camera-based analytics detects and tracks each person as a separate object, so it stays accurate even with group entries; EscherSense measures 96.2% in the field. The real difference is scope: a sensor only counts, while a camera also delivers paths, queues, shelf interaction and conversion from the same footage.
How are you different from 3D stereo or mmWave radar sensors?
3D stereo cameras and radar sensors count well, but they need dedicated hardware at every door and their data stops at a number. EscherSense uses the feed from your existing security cameras: no extra mounting, no extra cabling, no extra devices to maintain. Because sixteen separate metrics come from the same footage, cost per store stays flat rather than rising as you add modules.
Are staff and couriers included in the count?
No. Staff are identified by uniform, movement pattern and time spent in the store, and are excluded from the visitor count. Likewise, the same person re-entering within a short interval isn't counted twice. Without this separation, the calculated conversion rate comes out markedly lower than reality.
How many cameras does a store need?
Four to eight cameras are enough for a typical store: an overhead view of the entrance, the checkout area, the main aisles and the window. Mall stores may need two cameras depending on entrance width. Your current camera layout is reviewed during the site survey; most projects start without adding any new cameras.
Does it work for stores inside shopping malls?
Yes. In mall stores, passing traffic in front of the window and visitors who walk in are measured separately; the ratio between the two quantifies your window's pulling power. You see your own store's real capture rate without relying on the total footfall figure provided by mall management.
Will it conflict with my existing NVR or security software?
No. The system passively takes the camera stream via your NVR or directly from the camera; it doesn't touch your recording setup, camera settings or your security operator's screen. It runs alongside Milestone, Hikvision, Dahua and other ONVIF-compatible infrastructure.
How often do I get reports, and how?
The dashboard runs in real time, and daily, weekly and monthly summaries are sent by email. Data is accessible via REST API and CSV and connects directly to tools such as Power BI and Looker. Critical events, such as a queue threshold being exceeded, reach the store manager as instant alerts.
How soon will I see a return on investment?
Gains build up in three areas: fewer queue walkouts, staffing plans built on the real traffic curve, and window and shelf placement corrected with engagement data. In our pilot stores we measured a 34% drop in average wait time. Typical payback is in the 6–14 month range, depending on store revenue.
How do the contract and pilot terms work?
The site survey and camera suitability assessment are free. A single-store installation is completed within one week; at the end of the 30-day pilot, results are reviewed using your real data. Chain-wide rollout is discussed based on the numbers the pilot produces; no upfront hardware investment is required.
Start with one store and see the difference in numbers
Set up in one week using your existing cameras; at the end of the 30-day pilot we walk you through your traffic, your true conversion rate and where you're losing sales, in a concrete report.